Before digging into the real-world you need start the docker images of ElasticSearch and Kibana, TAG and the Movie-Api app.
Run the docker image for ElasticSearch:
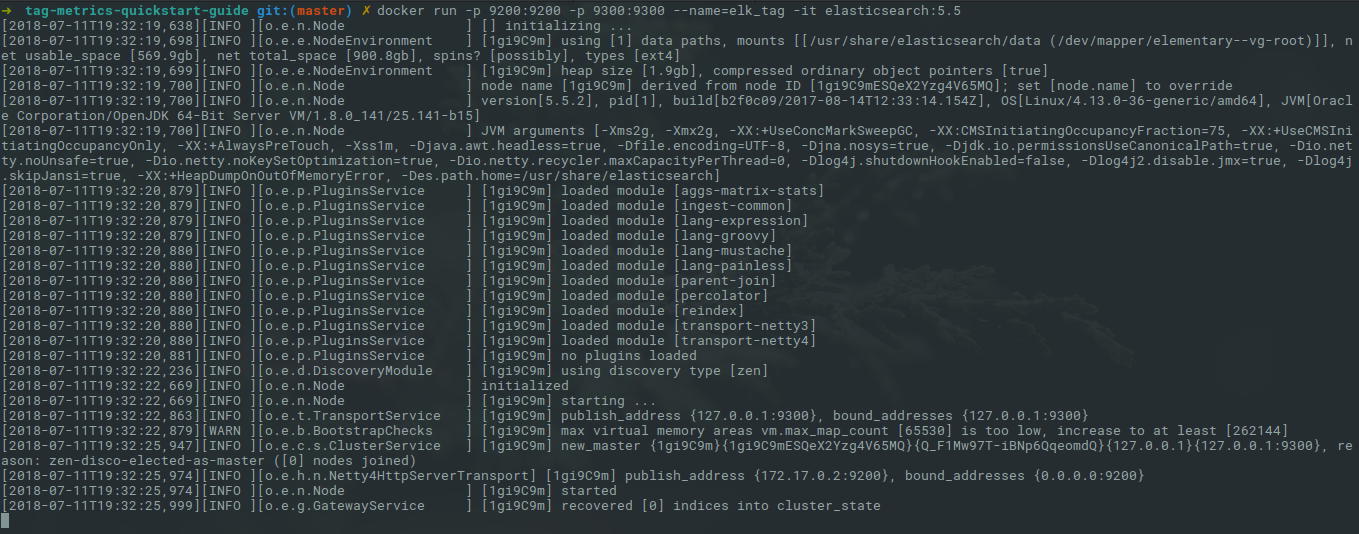
docker run -p 9200:9200 -p 9300:9300 --name=elk_tag -it elasticsearch:5.5After a few seconds you should see the logs like this:
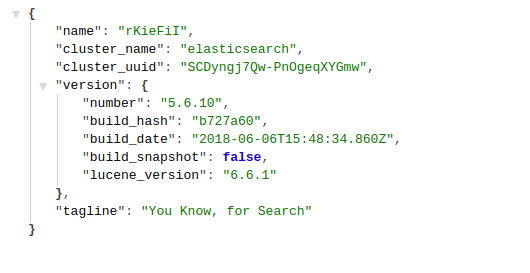
Test if ElasticSearch is properly running, thus in a web browser access http://localhost:9200. You will be able to see a page like this:
Run the docker image for Kibana.
For Linux:
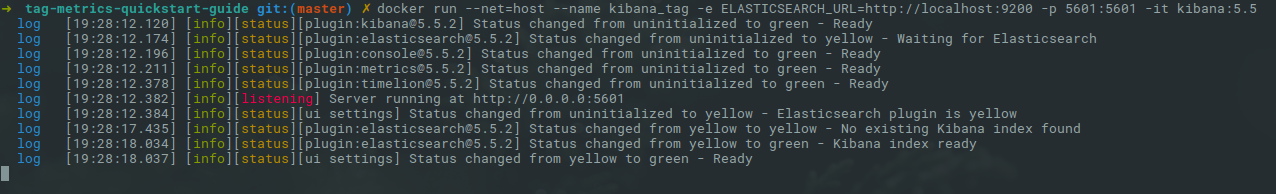
docker run --net=host --name kibana_tag -e ELASTICSEARCH_URL=http://localhost:9200 -p 5601:5601 -it kibana:5.5For OSX:
docker run --net=host --name kibana_tag -e ELASTICSEARCH_URL=http://host.docker.internal:9200 -p 5601:5601 -it kibana:5.5After a few seconds you should see the logs like this:
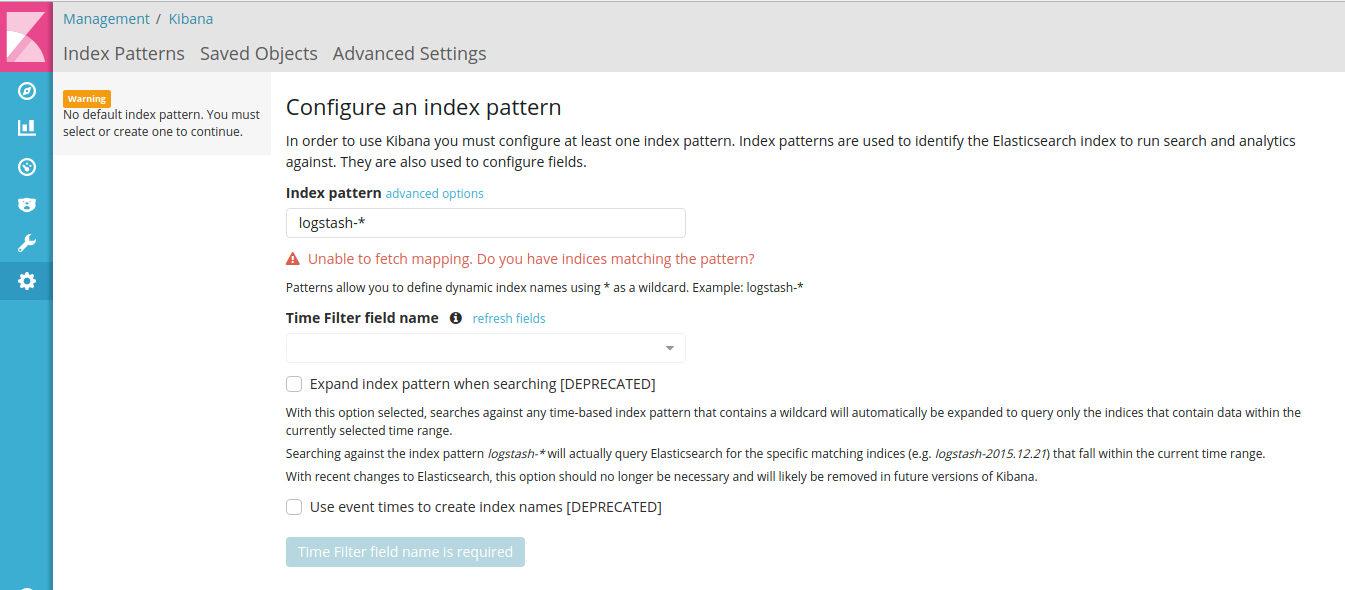
You can access Kibana using the URL http://localhost:5601. This is the Kibana index configuration page. At this point Kibana is ready to receive the index configuration during TAG first startup so there is no need to configure anything from Kibana UI:
Go to the terminal, press Ctrl P + Ctrl Q and detach the previous docker image. If you already have TAG running, stop the image using the command:
docker stop tagThen run TAG with Metrics configured pointing to the ElasticSearch and Kibana you started.
For Linux:
docker run --name=metrics_tag -it -p 8080:8080 --net=host -e LICENSE=accept -e ELASTICSEARCH_HOST=localhost -e KIBANA_HOST=localhost tomitribe/tribestream-api-gatewayFor OSX:
docker run --name=metrics_tag -it -p 8080:8080 -e LICENSE=accept -e ELASTICSEARCH_HOST=host.docker.internal -e KIBANA_HOST=host.docker.internal tomitribe/tribestream-api-gatewayTAG is ready when you see the following message on the TAG log:
INFO [main] org.apache.coyote.AbstractProtocol.start Starting ProtocolHandler ["http-bio-8080"]
INFO [main] org.apache.coyote.AbstractProtocol.start Starting ProtocolHandler ["ajp-bio-8009"]
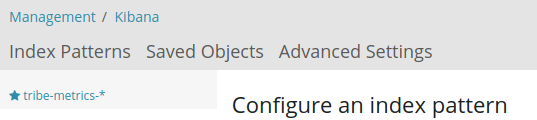
INFO [main] org.apache.catalina.startup.Catalina.start Server startup in 18348 msAfter seeing this log message and the server is started you will be able to see Kibana running configured with the tribe-metrics-* index.
Go to the terminal, press Ctrl P + Ctrl Q and detach the previous docker image. If you already run movie-api in the previous quickstart guides just execute:
docker start movie-apiIf you didn’t run previously execute the following command.
For Linux:
docker run --net=host -d -p 9090:9090 --name movie-api tomitribedev/movie-apiFor OSX:
docker run -d -p 9090:9090 --name movie-api tomitribedev/movie-apiFor this demo, you need to clone the git repository tomitribe/tag-metrics-quickstart-guide and execute a script to load pre-configured data.
git clone https://github.com/tomitribe/tag-metrics-quickstart-guide
cd tag-metrics-quickstart-guide
Execute the script below:
./scripts/load_configuration.shNow we will check some scenarios to help you better understand how metrics can help you.
The Tribestream API Gateway has a great feature to help you monitor your microservices. When a request from a client hits TAG, the gateway will create an event containing everything that happened on that request. The events are sent and stored in ElasticSearch. Kibana will consume the data and show it in some awesome out of the box dashboards that will help you to monitor all traffic to your microservices. You will no longer be blind without information, as you have an amazing tool to help you manage and effectively support clients using your APIs.
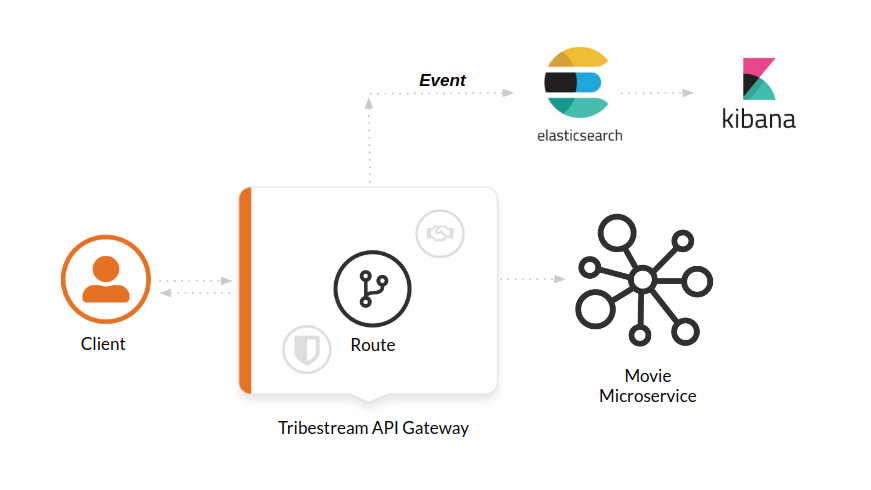
So how does all this work? Let’s dig in some real world scenarios.
Let’s simulate a user trying to authenticate into TAG and being denied. We will use username bob1.
curl -XPOST -d "grant_type=password&username=bob1&password=12345678&client_id=bob-mobile-client&client_secret=12345678" http://localhost:8080/oauth2/tokenUser receives response:
{"error_description":"The resource owners credentials are invalid","error":"grant_invalid"}%TAG didn’t authenticate and the user decides to reach out and ask what is the issue.
As a TAG Administrator I can use Discover in Kibana and the Built in Dashboards to advise the user. First step is to go to the Discover menu and try to find the request for the username _bob1. Type the lucene query to filter the request for that user and press enter.
category:request AND authentication.profiles.username:bob1The request is there, click JSON. In the payload, into authentication property you will see the error code user_not_found saying the user was not found.
...
"request_id": "b199f6da92149309",
"authentication": {
      "elapsed_ns": 8199852,
      "errors": [
        {
          "code": "user_not_found",
          "profile": "Default OAuth2 profile"
        }
      ],
      "result": "denied",
      "profiles": [
        {
          "username": "bob1",
          "name": "Default OAuth2 profile",
          "grant_type": "password",
          "result": "denied",
          "type": "oauth2",
          "client_id": "bob-mobile-client"
        }
      ],
      "elapsed_sec": 0.008199852
    },
...
You can also analyze this request in the OAuth2 Dashboard, therefore copy the request id from the payload and go to the menu Dashboard → link:
://localhost:5601/app/kibana#/dashboard/OAuth2-Dashboard[OAuth2 Dashboard].
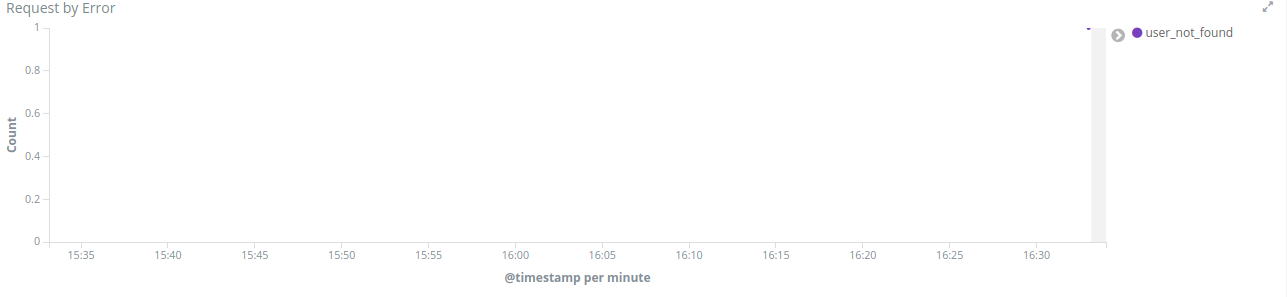
Add the AND <request_id> to the lucene query input and press enter. If you check the Request by Error visualization you will see the user_not_found error is there.
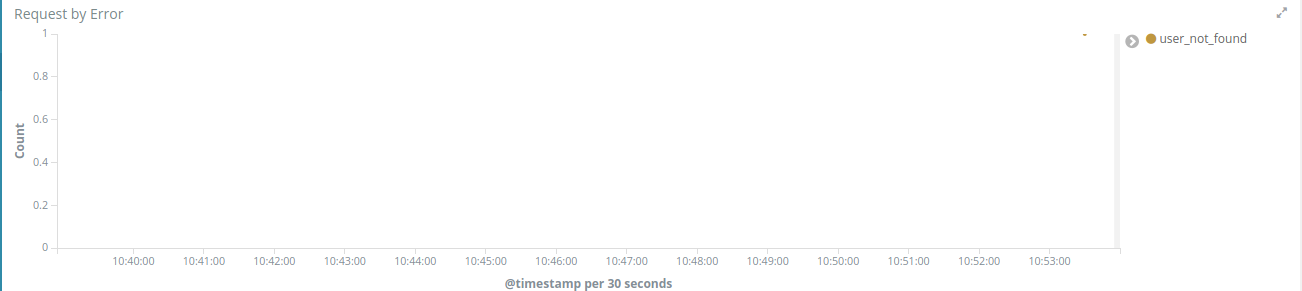
Now you can advise the user saying the issue is: The user was not found and he may use valid user.
The user realizes the username is actually bob, and tries again.
curl -XPOST -d "grant_type=password&username=bob&password=12345678&client_id=bob-mobile-client&client_secret=12345678" http://localhost:8080/oauth2/t

oken
User will be able to authenticate properly. You can go again to the OAuth2 Dashboard and check that the user was able to authenticate.
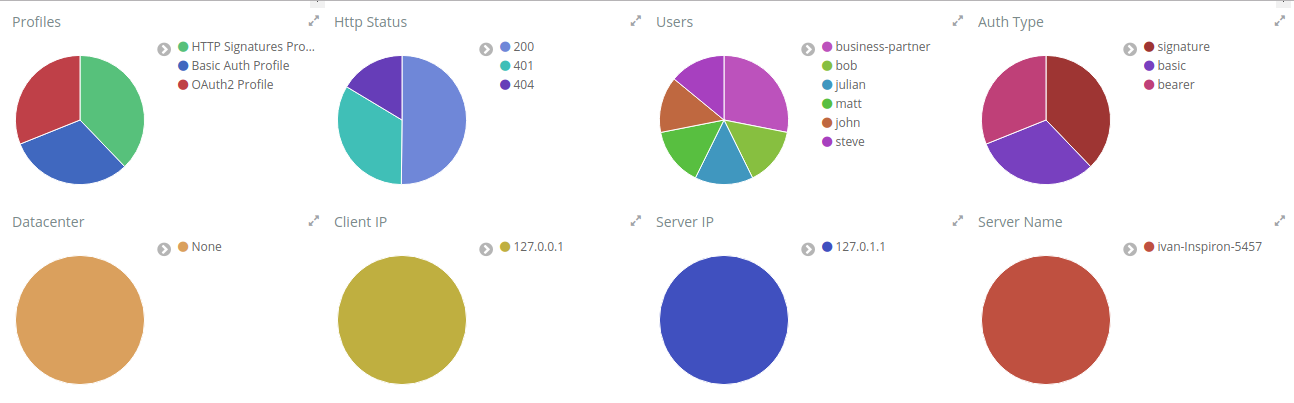
The OAuth2 Dashboard has all the authentication information related to OAuth2. Therefore here we have in the Requests visualization the two requests you did and with the date and their request ids. It can be used for filtering on the Discover menu if you want to see the full payload.
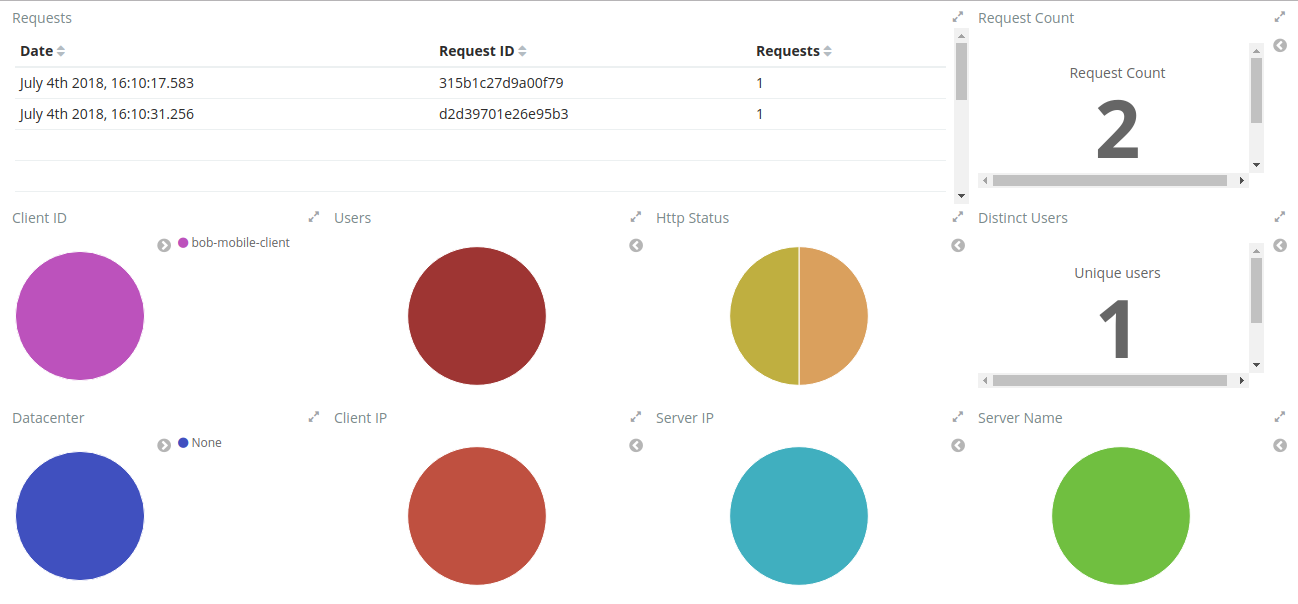
The visualizations are mostly clickable so, for example, you can click in the Http Status 200 and it will filter the entire Dashboard. Also to checking in the arrow in the top right of each visualization will show you the legends. A lot of useful information are also in the pie charts, like Client ID, Users, Datacenter, Client IP, Server IP and so on.
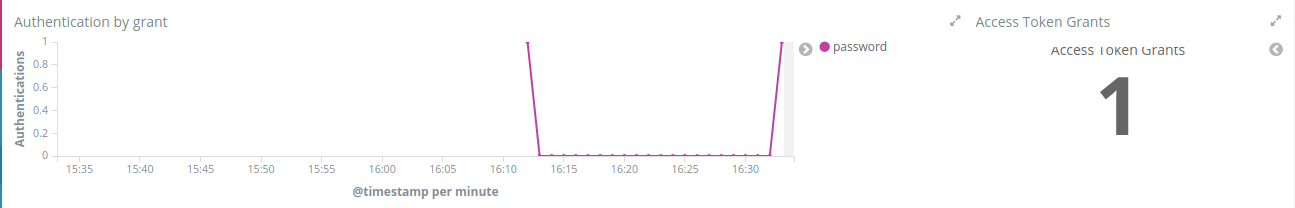
The Authentication by grant visualization will show you how many requests were done per grant type over the time. The next image shows we did two over a period of time and the right side visualization shows 1 access token grant was issued.
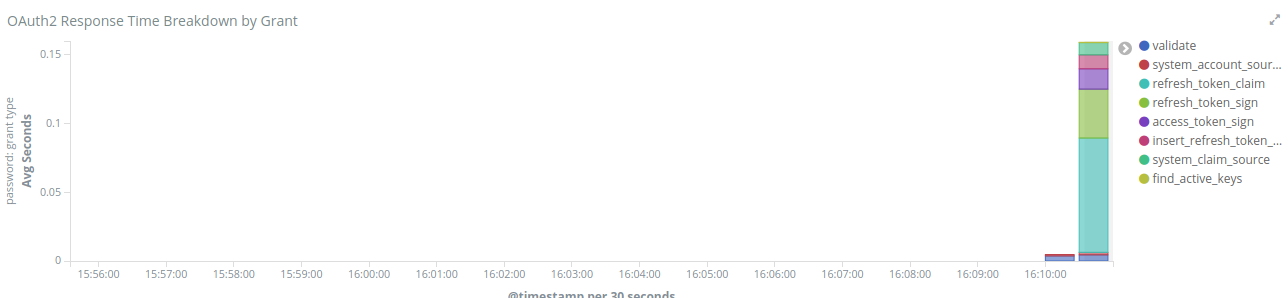
The OAuth2 Response Time Breakdown by Grant will show you how long each part of the grant took to execute in second. So this will help to identify where the slowness is if there is one. The response time may be affected by an external system that TAG uses, like LDAP, or an external API claim source for example.
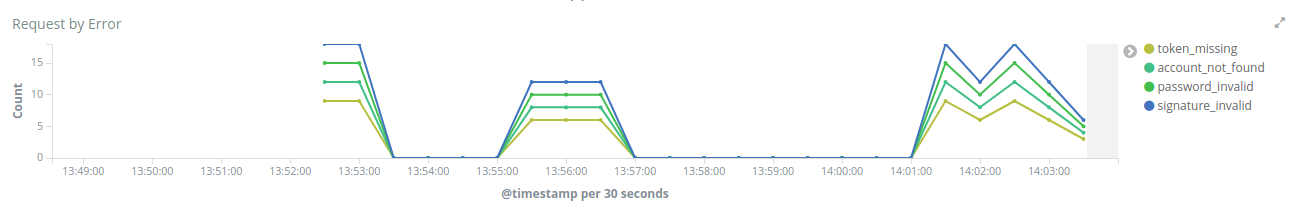
The Request by Error will tell you the reason a request failed, just like we saw previously.
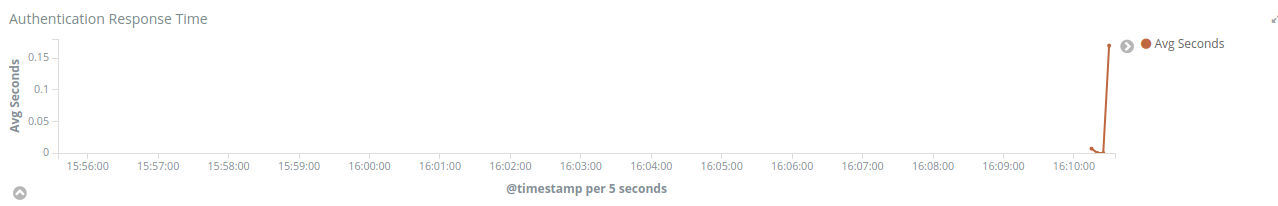
The Authentication Response Time will tell you the average time in seconds the authentication took to execute.
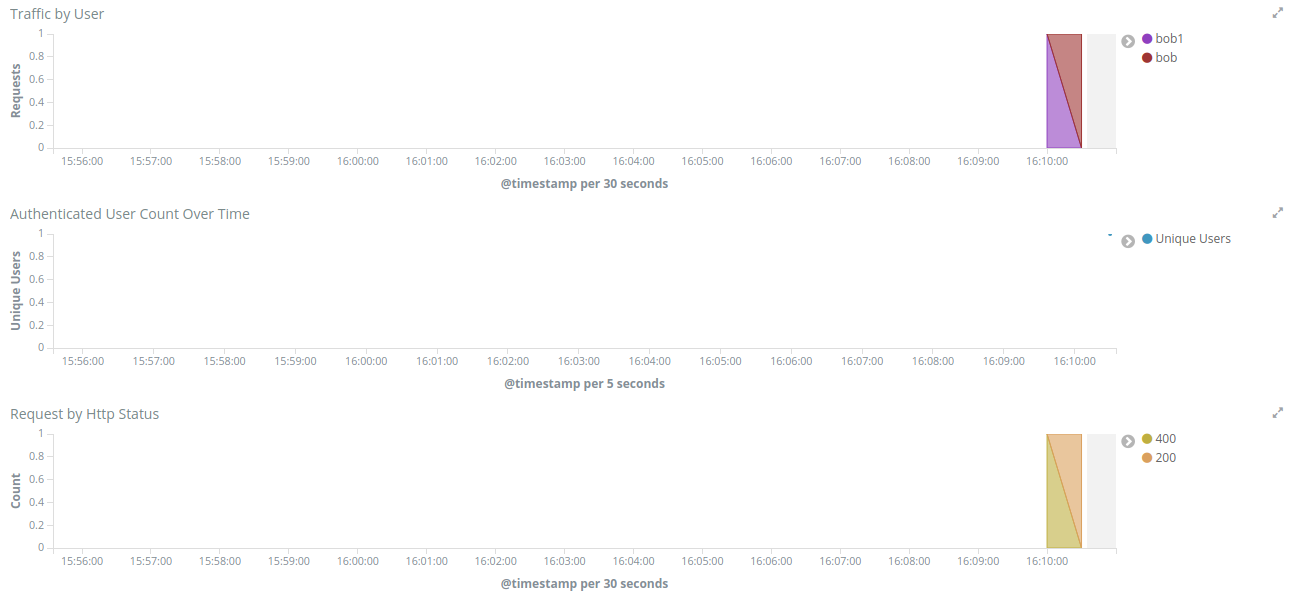
And the last three visualizations in the OAuth2 Dashboard are:
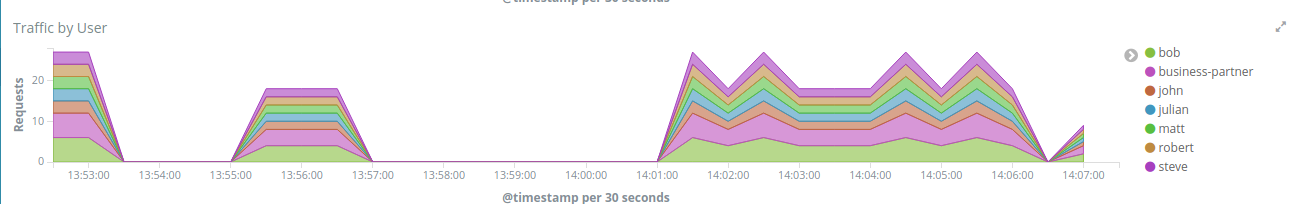
Traffic by User - It will show you the requests by User over a period of time.
Authenticated User Count Over Time - It will show the Unique Users authenticated over a period of time.
Request by Http Status - It will show you the number of requests over a period of time.
Now that we learned about the OAuth2 Dashboard, let’s go to the next scenario.
The script below will sign the request to Movies Micro-service, protected with Http Signature, with the business-partner-key.
./scripts/sign.sh --key business-partner-key --secret "secret" -X GET http://localhost:8080/movies-microserviceAfter that, as TAG Administrator, go to Kibana Dashboard → Proxy Dashboard
In the Keys table you will see the Exp. Date for business-partner-key which is two days from now. Click Filter for value in the Key Id column and Apply now.
Then check the pie chart Users and see who is using that key and advise him to update it.
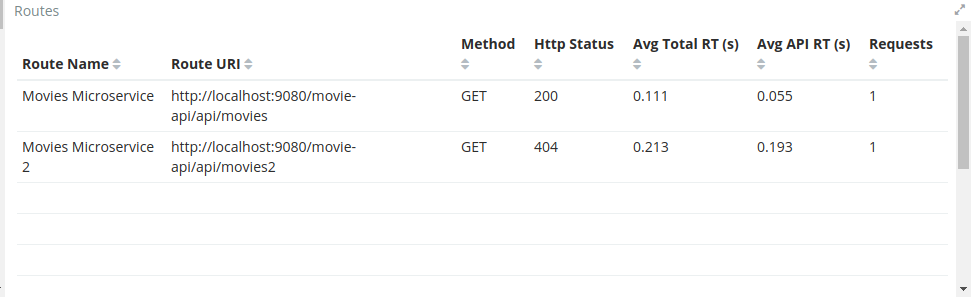
We will again do a signed request but to Movies Micro-service 2.
./scripts/sign.sh --key business-partner-key --secret "secret" -X GET http://localhost:8080/movies-microservice2After executing it, let’s go to the Proxy Dashboard again. In the _Routes visualization you will see that the Route Movies Microservice 2, is returning 404, therefore TAG is returning 404 as well. You can see very clear here that TAG found the route to Movies Microservice2 but the back-end didn’t have the service.
Execute the script below, it will call TAG several times and you will see the Proxy Dashboard with populated more data. It will take 60 seconds to finish.
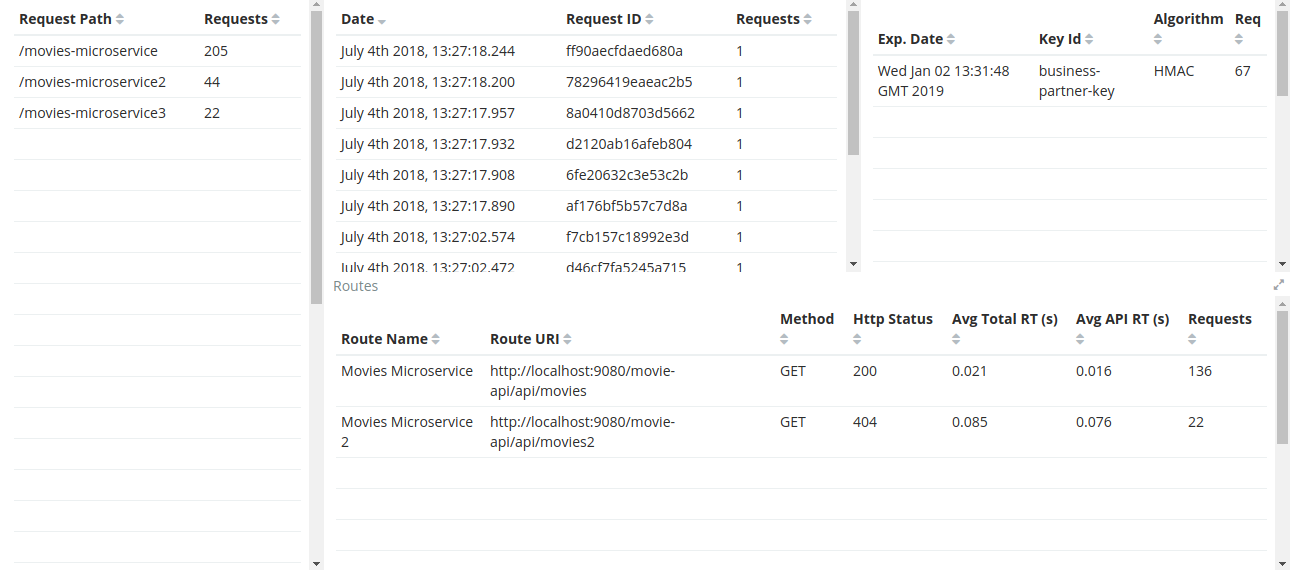
./scripts/call_microservices.shIn the Proxy Dashboard you will be able to analyze the requests in several visualizations.
Request Path - will show you how many requests were sent to a path.
Requests - will show you the date and request id.
Keys - will show you the key information.
Routes - will show you where the request was routed to, method, status, average total response time, and average response time which measures how long the micro-service took to respond.
After the top tables you will see the pie charts, that have very useful data for filtering just like we mentioned in the OAuth2 Dashboard.
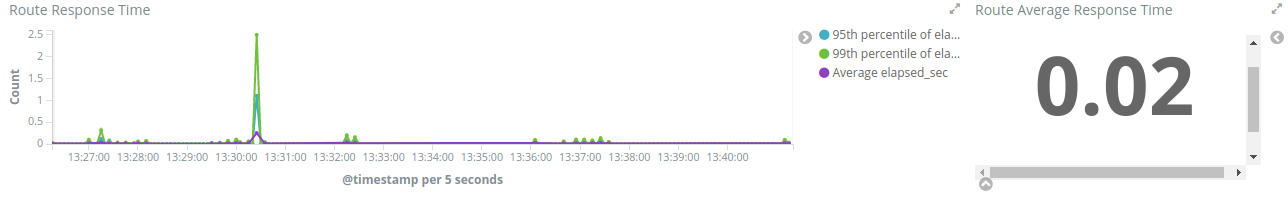
The Proxy Dashboard also provides a way to analyze percentiles. The visualization Route Response Time will help you to analyze if in an ordered sample a small number of users may be having lower performance than others. 95th or 99th for example may provide spikes if only few users are having bad performance in a period of time. Also in the right side there is the Route Average Response Time.
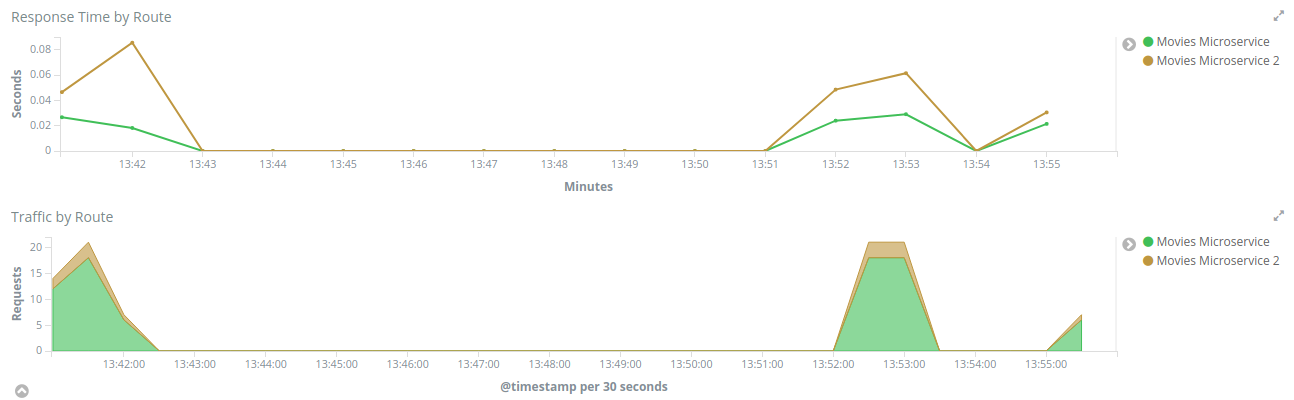
The Response Time by Route, will help you to compare response times between routes, which may help you to identify low performance routes and take an action.
The Traffic by Route, will tell you how many requests were sent to each route, which may help you to identify the most active microservices you have.
The Request by Error is the same as the one we checked in the OAuth2 Dashboard, but now in a different scenario where we called /google with an expired access token, therefore the visualization will show the issue explicitly.
The Traffic by User will how you how many requests a user is doing in a period of time. It may help you to spot attacks or even credentials being shared in case the number is too high for a specific user.
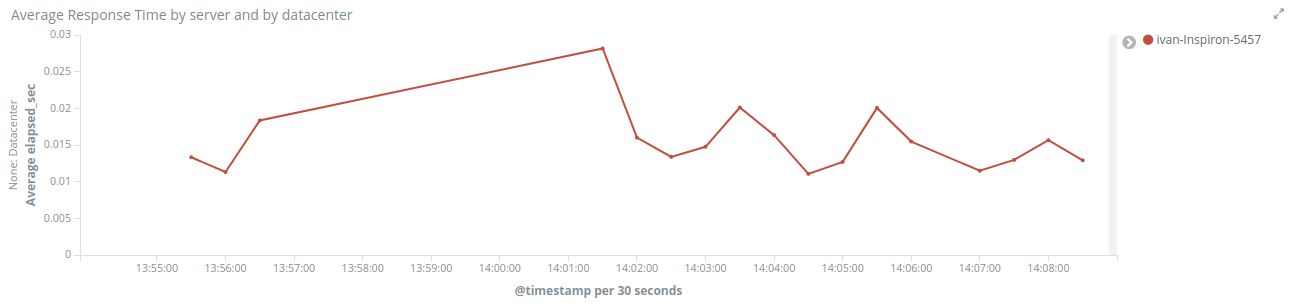
The last one in the list is Average Response Time by server and by datacenter, which will show you exactly what the name says.