Time: 10 minutes
Learning objectives
Elastalert requirements
Create and test your first TAG alert
Prerequisites
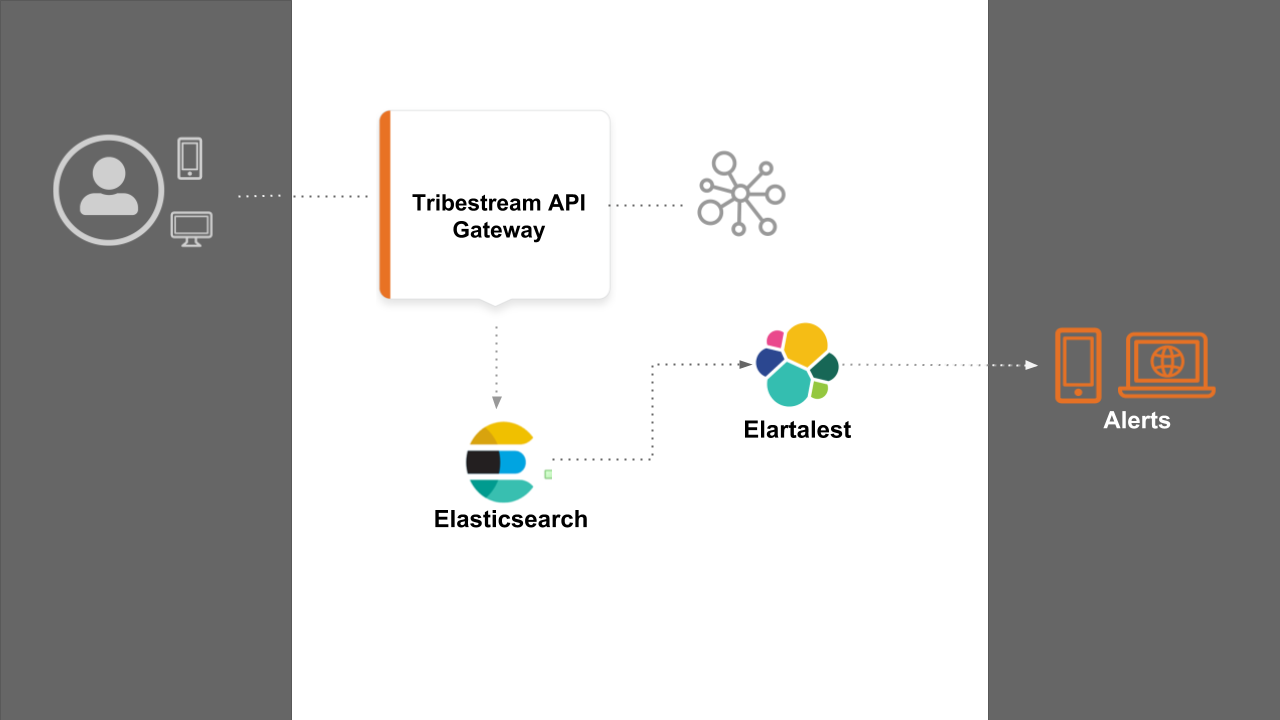
During this guide we are going to learn how to setup alerts from TAG telemetry events. In the diagram the main actors we can identify are:
Tribestream API Gateway (TAG) who sends telemetry data to Elasticsearch.
Elasticsearch server containing all the telemetry data in real time.
Elastalert service pulling Elasticsearch data to perform alerts operations.
Before installing Elastalert, make sure you have a TAG server up and running and sending telemetry data to a local Elasticsearch server.
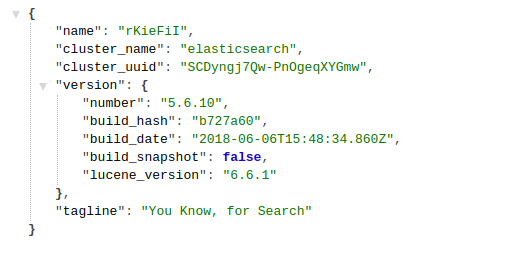
To test if Elasticsearch is properly running, open a web browser and access http://localhost:9200. You will be able to see a page like this:
Elastalert is a service that perform alerts base on anomalies, spikes, or other patterns of interest from data in Elasticsearch. It’s reliable, highly modular, and easy to set up and configure.
It works by combining Elasticsearch with two types of components: rule types and alerts. Elasticsearch is periodically queried (default to 1 minute) and the data is passed to the rule type, which determines when a match is found. When a match occurs, it is given to one or more alerts, which take action based on the match.
Several rule types with common monitoring paradigms are included with ElastAlert:
“Match where there are X events in Y time” (frequency type)
“Match when the rate of events increases or decreases” (spike type)
“Match when there are less than X events in Y time” (flatline type)
“Match when a certain field matches a blacklist/whitelist” (blacklist and whitelist type)
“Match on any event matching a given filter” (any type)
“Match when a field has two different values within some time” (change type)
Elastalert has built in support for alert types like: Command, Email, JIRA, OpsGenie, SNS, HipChat, Slack, Telegram, Debug, Stomp.
For this guide we are going to use Slack messaging service as the alert type via a Slack Webhook URL.
Official Elastalert documentation requires a couple of Unix system requirements like Python 2.7, pip and ISO8601 or Unix timestamped data.
For the purpose of this guide, we are going use a Docker container (bitsensor/elastalert) that already have a pre installed and configured Elastalert instance and also provides a REST endpoint to interact with Elastalert service running inside the container.
Let’s learn now about the configuration files required before starting our Elastalert docker container.
On your system create the following folders and files structure:
.
├── elastalert-home
│   ├── config
│   │   ├── config.json
│   │   └── elastalert.yaml
│   └── rules
│       └── errors_401.yaml
elastalert-home: Home folder we are going to use to start the Elastalert Docker container.
config: This folder contains the Elastalert global configuration file and the REST endpoint configuration.
rules: Folder used to store all the rules Elastalert will be loading during boot.
config.json: This file contains the general configuration for the REST endpoint provided by the Docker container to the outside host. This files not need it if you are running a bare metal installation of Elastalert without docker.
elastalert.yaml: Is the Elastalert global configuration file.
errors_401.yaml: The file containing the first rule we are going to use in this guide. The rule checks for more than three TAG responses with HTTP 401 code in the last minute. If the rules matches and event, then the alert will be trigger using Slack WebHooks. For specific alerting configuration you can check the Elastalert official documentation.
The content of config.json should look like this:
{
  "appName": "elastalert-server",
  "port": 3030,
  "elastalertPath": "/opt/elastalert",
  "verbose": false,
  "es_debug": false,
  "debug": false,
  "rulesPath": {
    "relative": true,
    "path": "/rules"
  },
  "templatesPath": {
    "relative": true,
    "path": "/rule_templates"
  }
}
The content of elastalert.yaml should look like this:
rules_folder: rules
run_every:
  seconds: 10
buffer_time:
  minutes: 15
es_host: localhost
es_port: 9200
writeback_index: elastalert_status
alert_time_limit:
  days: 2
Important If your operating system is OSX or Windows, you must use host.docker.internal instead of localhost for the es_host configuration value.
The content of errors_401.yaml should look like this:
# Alert when more than 3 event with returns http_status:401 appears in 1 minute time range.
# Elasticsearch server to be monitored
es_host: localhost
es_port: 9200
# Rule name, must be unique
name: errors_401
type: frequency
index: tribe-metrics-*
num_events: 3
timeframe:
minutes: 1
filter:
- query:
query_string:
query: "source:TAG AND http_status=401"
# Alert configuration
alert:
- "slack"
slack:
slack_webhook_url: "YourSlackWebhookURL"
slack_emoji_override: ":robot_face:"
slack_msg_color: "warning"
alert_text: "You can check the alert dashboard on Kibana: yourKibanaURL"
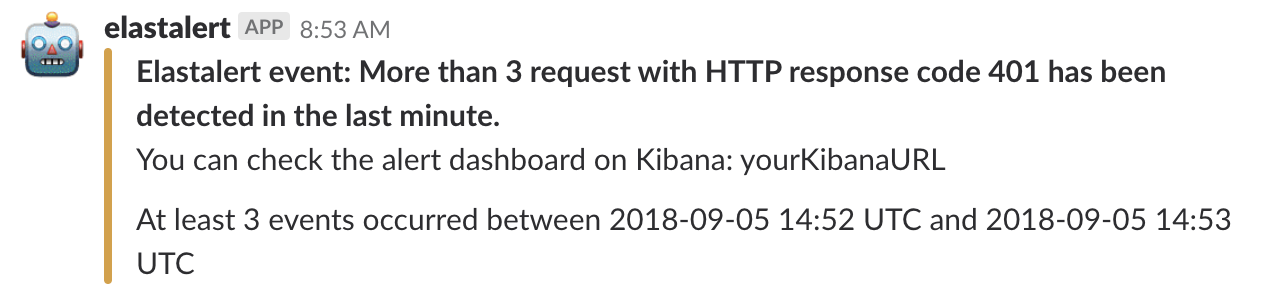
alert_subject: "Elastalert event: Morte than 3 request with HTTP response code 401 has been detected in the last minute."
alert_text_type: exclude_fieldsImportant
If your operating system is OSX or Windows, you must use host.docker.internal instead of localhost for the es_host configuration value.
Remember to substitute YourSlackWebhookURL with the value of your slack WebHookURL.
On a terminal and inside the folder elastalert-home execute the following command according to your operating system:
For linux:
docker run -p 3030:3030 \
    -v `pwd`/config/elastalert.yaml:/opt/elastalert/config.yaml \
    -v `pwd`/config/config.json:/opt/elastalert-server/config/config.json \
    -v `pwd`/rules:/opt/elastalert/rules \
    --net="host" \
    --name elastalert bitsensor/elastalert:0.0.12
For OSX or Windows:
docker run -p 3030:3030 \
    -v `pwd`/config/elastalert.yaml:/opt/elastalert/config.yaml \
    -v `pwd`/config/config.json:/opt/elastalert-server/config/config.json \
    -v `pwd`/rules:/opt/elastalert/rules \
    --name elastalert bitsensor/elastalert:0.0.12
Elastalert is ready when you see the following information:
23:10:55.460Z  INFO elastalert-server: ProcessController:  Index create exited with code 0
23:10:55.460Z  INFO elastalert-server: ProcessController:  Starting elastalert with arguments [none]
23:10:55.467Z  INFO elastalert-server: ProcessController:  Started Elastalert (PID: 45)
23:10:55.468Z  INFO elastalert-server: Server:  Server listening on port 3030
23:10:55.468Z  INFO elastalert-server: Server:  Server started
To detach the Elastalert container log output, type on the terminal: ctrl+p followed by ctrl+q
On a terminal execute at least four time the following command:
curl -i http://localhost:8080/api/http/test/hosts/registerYou should be able to see the TAG response with at 401 HTTP code:
HTTP/1.1 401 Unauthorized
Access-Control-Allow-Origin: *
Access-Control-Allow-Headers: origin, content-type, accept, authorization, Etag, if-none-match, x-xsrf-token
Access-Control-Allow-Credentials: true
Access-Control-Allow-Methods: GET, POST, PUT, DELETE, OPTIONS, HEAD
Access-Control-Max-Age: 1209600
Access-Control-Expose-Headers: origin, content-type, accept, authorization, ETag, if-none-match
X-Proxy-Do-Rewrite: 424792
X-Request-ID: 5bfc644bf981b44f
Content-Type: application/json;charset=ISO-8859-1
Content-Language: en
Content-Length: 54
Date: Tue, 04 Sep 2018 23:15:03 GMT
Server: Tomitribe-TAG

{"error":"This request requires HTTP authentication."}
Then you should be able to see the alert triggered on your slack channel configured on the erros_401.yaml rule.